Introduction
This is some python and R code I wrote to make comparisons between different kids’ mountain bikes that are available in North America this year. There are for 2018 a number of dozen bikes now available in the 24” wheel size at a price and quality level suitable for real trail riding. In addition, there are 26” wheel sized bikes coming to market, as well as extra-small sized 27.5” wheel bikes. Choosing a bike out of this assortment has become potentially more time consuming, although quite frankly most kids will be happy with any new bike. Nevertheless for those about to shop, you may find some of these comparisons to be of use.
The raw data for the bikes are located in a google sheet
The comparisons are currently being done in two forms, geometry and price/weight regressions.
Geometry

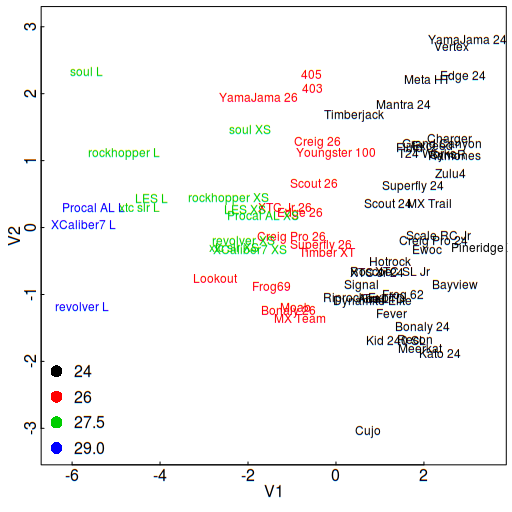
Figure 1. Principal components of the bicycle geometry parameters
Bicycle geometry has 10 or 11 different parameters, not all of which are independent. Traditionally, the values of these parameters are tabulated by manufacturers, and are compared by buyers to help understand sizing and fit. In a 10 parameter space though, this is not actually that easy to do.
One of the first things to try was reducing the dimension of the parameter space with principal components. The result for the top two components is shown here. The plot is colour-coded by wheel size, and shows that in the first principal component (V1), the bikes are separated more or less in accordance with the wheel diameter, but it’s not just wheel diameter it’s a combination of all the size-related dimensions in the geometry. In the second component dimension (V2), there is an additional spread amongst bikes, which may now represent other non-size related factors like bottom bracket drop, angles, and so on.
What this presentation of the geometry data allows is a much quicker and more intuitive grasp of which bikes are similar to one another, and which are different. With this high-level relationship in mind, consulting the geometry tables for the details is a more informed process.
Price/Weight Regression
Weight has long been a key factor in selecting a performance bike, along with the price. Despite the importance of the price-weight relationship, bicycle manufacturers have traditionally been loathe to reveal weight information, and yet there shouldn’t really be any magic to it. Weight ought to be a very straightforward function of the quality of the components and frame that make up the bike, with price being the measure of quality. If that is true, then it should be possible to construct useful linear regressions for price and weight.
Shown here is an example of a multi-variate regression of weight against price and component specification for the bikes with known weights.

Figure 2. Weight-price regression
In this plot, the known weights for the bikes are indicated by the orange dot, while the uncertainty range of the model predicted value is given by the vertical black line. Almost all the bike weights fall within the prediction uncertainty, and the average deviation of the prediction is 0.65 lb. The bikes to look for are those that fall at or even below the bottom of the model predicted range. That indicates they offer extra value for the price as compared to the group as a whole. In addition, there are seven bikes for which no weight is available, so it is predicted from the model and the uncertainty range is plotted in blue. The three to watch here are Scout 24/26 and YamaJama 26, all new bikes just coming to market in mid 2018, and when weights do become available it will be a good test of the model.
Details and Results
More details of the geometry and regression analyses are described in this document, along with full results.
